

In an era where AI-generated content floods the web and automated outreach templates choke journalists' inboxes, generic link-building tactics have reached a point of total diminishing returns. To capture authoritative, dofollow backlinks from tier-1 media powerhouses like Forbes, Bloomberg, TechCrunch, and Reuters, enterprise brands must transition from transactional link begging to legitimate data-driven journalism. When you publish proprietary, statistically validated industry research, journalists do not merely link to you out of courtesy—they cite you as an indispensable primary source.
Tier-1 journalists are governed by strict editorial verification standards. They face relentless daily deadlines and have zero interest in linking to promotional guest posts or generic blog articles. However, reporters are constantly hungry for original, credible data that substantiates breaking narratives. By mastering survey architecture, cross-tabulation mining, and embargoed pitching, you turn your brand into an authoritative newsmaker.
1. The Death of Generic Outreach and the Rise of Data-Driven Journalism
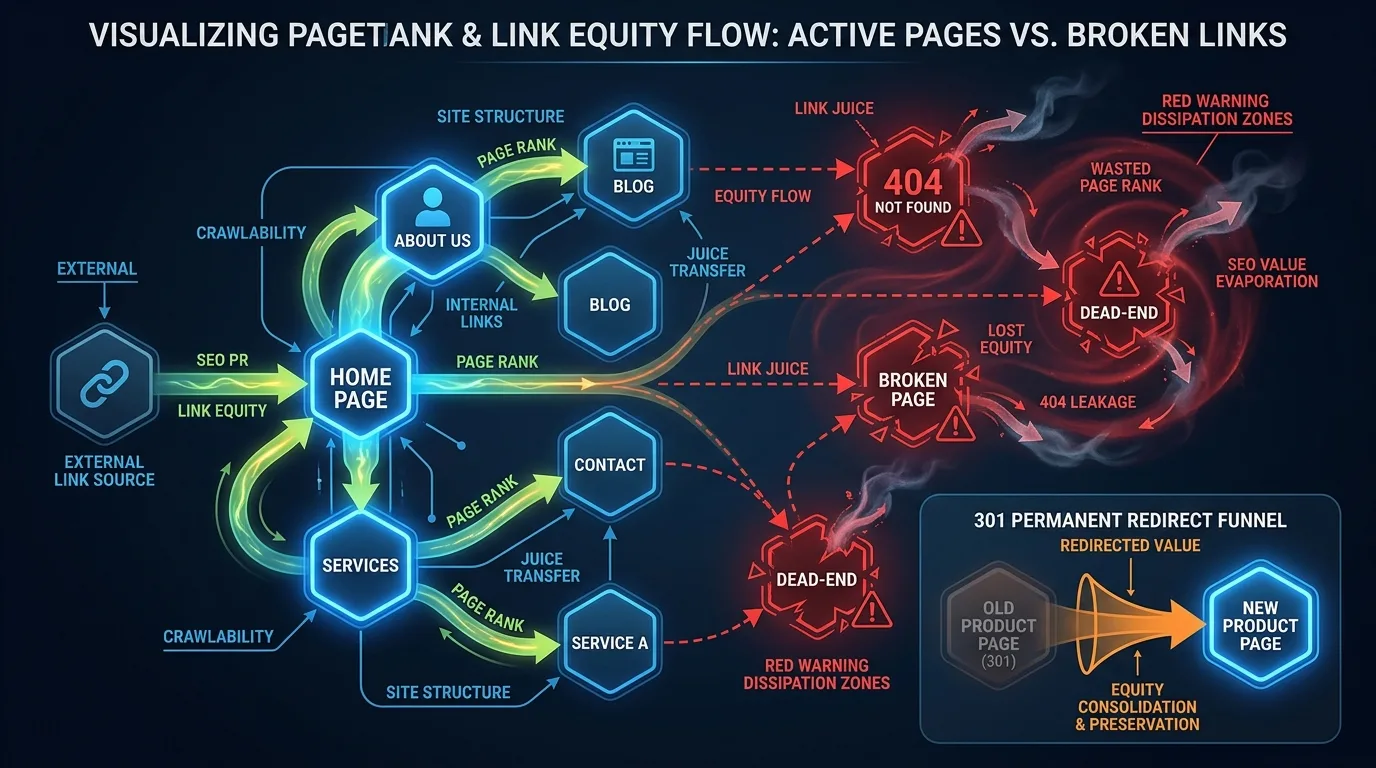
Over the past decade, search engine algorithms have dramatically refined how they evaluate backlink equity. Under Google's modern SpamBrain and Helpful Content architectures, low-tier link exchanges, sponsored directory inclusions, PBN networks, and automated skyscraper email blasts are either devalued to zero or actively penalized. What remains universally effective—and immune to algorithmic devaluation—is editorial citation equity: organic hyperlinks embedded naturally within news coverage written by professional journalists.
Journalists at premier publications operate under intense competitive pressure. A single technology or financial reporter may be required to publish two to four articles per day while fielding between 300 and 800 unsolicited PR pitches. The vast majority of these pitches commit fatal errors:
- They pitch company announcements, product feature releases, or self-serving executive promotions that lack broader societal or industry relevance.
- They regurgitate secondary statistics already published by Gartner, McKinsey, or government census bureaus months or years earlier.
- They present superficial "surveys" based on unscientific polls of 50 social media followers, lacking statistical significance or methodology disclosures.
Data-driven journalism flips this dynamic entirely. Instead of asking a journalist for a favor, you solve their most acute operational bottleneck: providing exclusive, freshly unearthed quantitative proof that validates an emerging industry trend. When your research serves as the factual backbone of their article, the journalist is ethically and professionally obligated to provide a descriptive attribution hyperlink back to your canonical report URL.
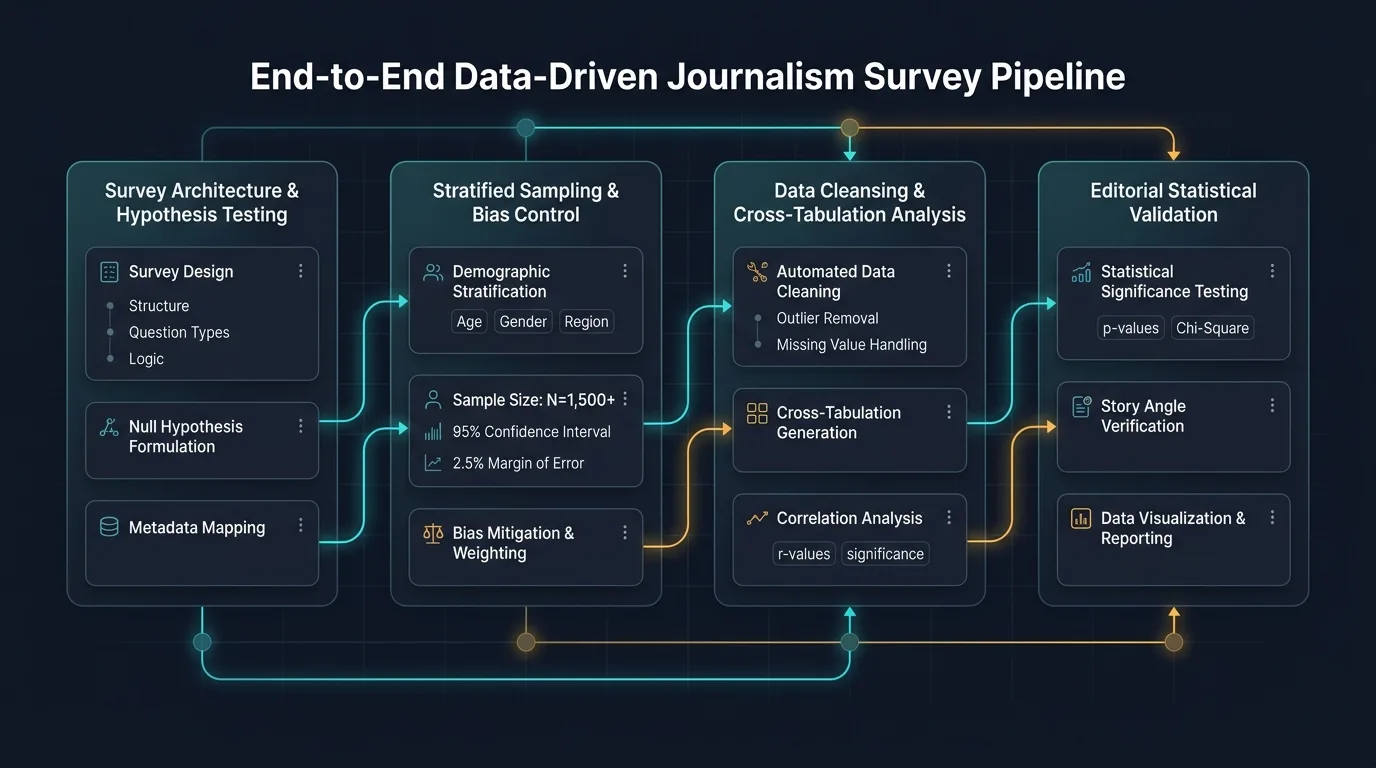
Furthermore, as highlighted in our comprehensive breakdown of the modern link building blueprint, tier-1 media citations generate dual value: they deliver immense PageRank juice and simultaneously feed Google's Knowledge Graph with co-occurring entity associations that solidify your brand authority.
2. Formulating Hypotheses and Designing Statistically Valid Survey Architectures
The success or failure of a data-driven PR campaign is determined long before the first outreach email is dispatched. It begins with rigorous question design. Amateurs launch surveys to see what happens; professional digital PR engineers design surveys to validate or disprove specific news-worthy hypotheses.
To craft a survey that journalists cannot resist, follow the Narrative Tension Formula. Identify a widely accepted industry dogma, a contentious emerging technology, or an economic friction point, and construct questions that quantify the unspoken reality. For instance, while enterprise software vendors boast about massive productivity gains from generative AI, an authoritative survey asking 1,000 enterprise developers about actual code deployment velocity might reveal that 62% spend more time debugging AI code than writing code from scratch. That is an explosive, front-page media headline.
Core Principles of Survey Architecture
- Isolate Singular Concepts per Question: Avoid "double-barreled" questions (e.g., "Do you find cloud software scalable and cost-effective?"). If a respondent feels cloud software is scalable but expensive, their answer becomes statistically corrupt.
- Balance Scale Anchors: When utilizing Likert scales (e.g., Strongly Agree to Strongly Disagree), always ensure an equal number of positive and negative options, complemented by a neutral midpoint. Skewed scales (e.g., Excellent, Great, Good, Fair) are immediately identified and discarded by investigative journalists.
- Mandatory Pre-Screening Filters: Build initial qualification gates to ensure only verified target professionals complete the survey. If your study examines enterprise cloud security budgets, any respondent without verified budgetary authority (e.g., CISO, VP of Engineering, Director of IT) must be disqualified immediately.
- Mix Quantitative Ranges with Concrete Values: While ranges (e.g., "$10k–$50k") increase completion rates, pairing them with specific numeric questions or behavioral choices produces sharper editorial soundbites (e.g., "Organizations lose an average of $24,500 per minute during unplanned database outages").
3. Sample Sizing, Demographic Stratification, and Bias Elimination
If you pitch a survey with an inadequate sample size or opaque methodology to a seasoned editor at The Wall Street Journal or Forbes, your pitch will be dismissed within seconds. To command journalistic respect, your methodology must withstand academic scrutiny.
The credibility of survey data is governed by two fundamental statistical parameters: the Confidence Level and the Margin of Error (Confidence Interval). For industry research to be cited as authoritative truth, standard practice requires a minimum 95% confidence level with a margin of error no greater than $\pm 3.0\%$.
| Target Population Scope | Estimated Universe Size | Required Sample (95% Conf, $\pm 5\%$ MoE) | Required Sample (95% Conf, $\pm 2.5\%$ MoE) | Editorial Credibility Grade |
|---|---|---|---|---|
| Niche B2B Segment (e.g., Fortune 500 CISOs) | ~500 to 1,000 | 217 to 278 | 357 to 450 | Grade A+ (Elite Niche Authority) |
| Vertical Industry (e.g., US SaaS Founders) | ~50,000 to 100,000 | 381 to 383 | 1,495 to 1,514 | Grade A (National Press Ready) |
| Broad Professional Segment (e.g., Software Developers) | 10,000,000+ | 384 | 1,537 | Grade A+ (Global Wire Standard) |
| General Consumer / Workforce | 100,000,000+ | 384 | 1,537 | Grade A+ (Mass Media Tier-1 Standard) |
Notice an illuminating statistical truth: whether your total population is 100,000 or 100,000,000, achieving a pristine $\pm 2.5\%$ margin of error at a 95% confidence level requires approximately 1,500 validated respondents. Consequently, conducting a study with N=1,500 to N=2,000 respondents serves as the gold standard for global media campaigns.
Always publish a dedicated "Research Methodology" section on your report page. Clearly disclose: the exact dates of data collection, the polling platform utilized (e.g., Censuswide, Prolific, Cint), the exact qualification criteria, the geographic breakdown, and the statistical margin of error. Complete transparency disarms skeptical reporters and prevents editorial retractions.
4. Data Mining the Gold: Cross-Tabulations and Counter-Intuitive Insights
Once raw survey responses are gathered and cleaned (scrubbing incomplete entries, speed-runners who finished in under 2 minutes, and automated bot responses), the real creative work begins: multivariate cross-tabulation analysis.
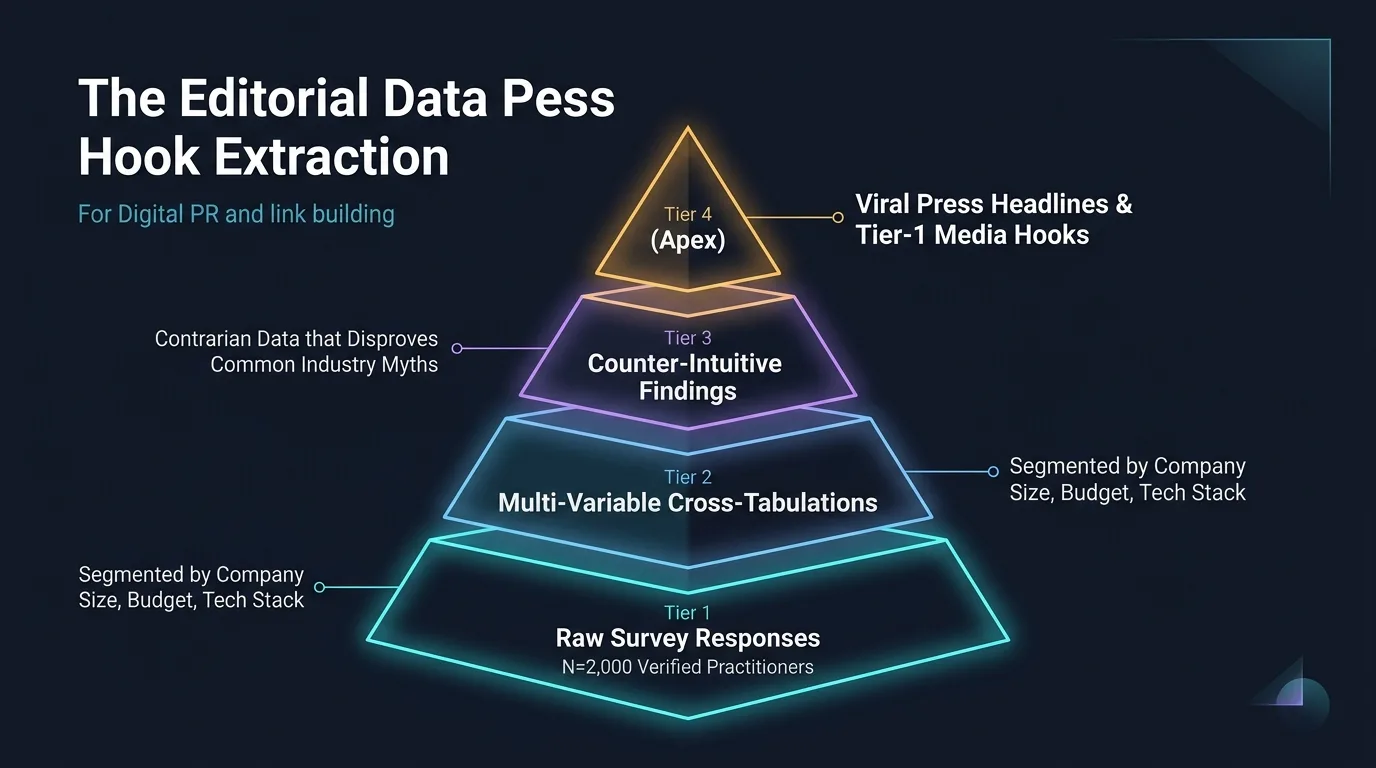
Amateur marketers simply report the top-line macro percentages: "74% of marketers use AI tools." This is boring, predictable, and virtually un-pitchable. High-impact data journalism lives in the intersections between demographic cuts, organizational sizes, spend tiers, and psychological attitudes.
Cross-Tabulation Mining Strategy
Slice your dataset across multiple cross-sections to unearth contrarian, surprising, or high-stakes friction points:
- Experience Level Disparities: Do junior employees perceive emerging challenges differently than C-level executives? (e.g., "While 81% of C-suite executives believe their company is AI-ready, 64% of front-line engineers report zero formal training").
- Budget vs Outcome Divergence: Do companies spending $1M+ annually on cybersecurity experience fewer breaches than those spending $100k? If the data reveals that mid-tier spenders actually suffer more breaches due to complex vendor sprawl, you have a captivating editorial angle.
- Generational & Geographic Divides: Contrast behaviors across Gen Z vs Boomers, or North America vs EMEA vs APAC. Regional discrepancies provide localized hooks for international bureau reporters.
By extracting 5 to 7 distinct narrative hooks from a single dataset, you don't just have one story to pitch—you have tailored story angles for tech reporters, finance columnists, HR publications, and enterprise management journals.
5. The Anatomy of an Irresistible Media Hook: Writing the Press Release Angle
Journalists do not write about surveys; they write about human drama, financial risk, technological disruption, and shifting cultural norms. Your survey data simply acts as empirical evidence validating that drama.
When translating data into a media pitch or press headline, employ the Problem-Impact-Data (PID) Structure:
- The Urgent Problem: An emerging vulnerability, market trend, or economic strain.
- The Measurable Impact: How real companies, workers, or consumers are affected.
- The Irrefutable Data Anchor: The specific percentage or financial figure proving the premise.
| Weak, Self-Serving Pitch (Ignored) | Data-Driven Journalistic Pitch (Cited) | Target Media Tier |
|---|---|---|
| "Acme Cloud launches new 2026 SaaS survey about server costs" | "Hidden Cloud Egress Fees Consume 38% of Series-B Startup Runways, New 1,500-Founder Study Reveals" | VentureBeat, TechCrunch, Business Insider |
| "Why SEO teams need to invest more in schema markup this year" | "83% of Fortune 500 E-Commerce Sites Fail Google's 2026 Semantic Schema Standards, Risking $4.2B in Organic Sales" | Search Engine Land, Marketing Dive, Adweek |
| "Our survey shows employees want more remote work flexibility" | "41% of Senior Financial Analysts Would Take a 15% Pay Cut to Avoid Mandatory Return-to-Office Mandates" | Bloomberg, CNBC, Wall Street Journal |
Notice how every successful pitch headline highlights tension, financial consequences, or behavioral trade-offs. The reader immediately understands the societal or economic stakes involved.
6. Designing Embeddable Data Visualizations and Interactive Infographics
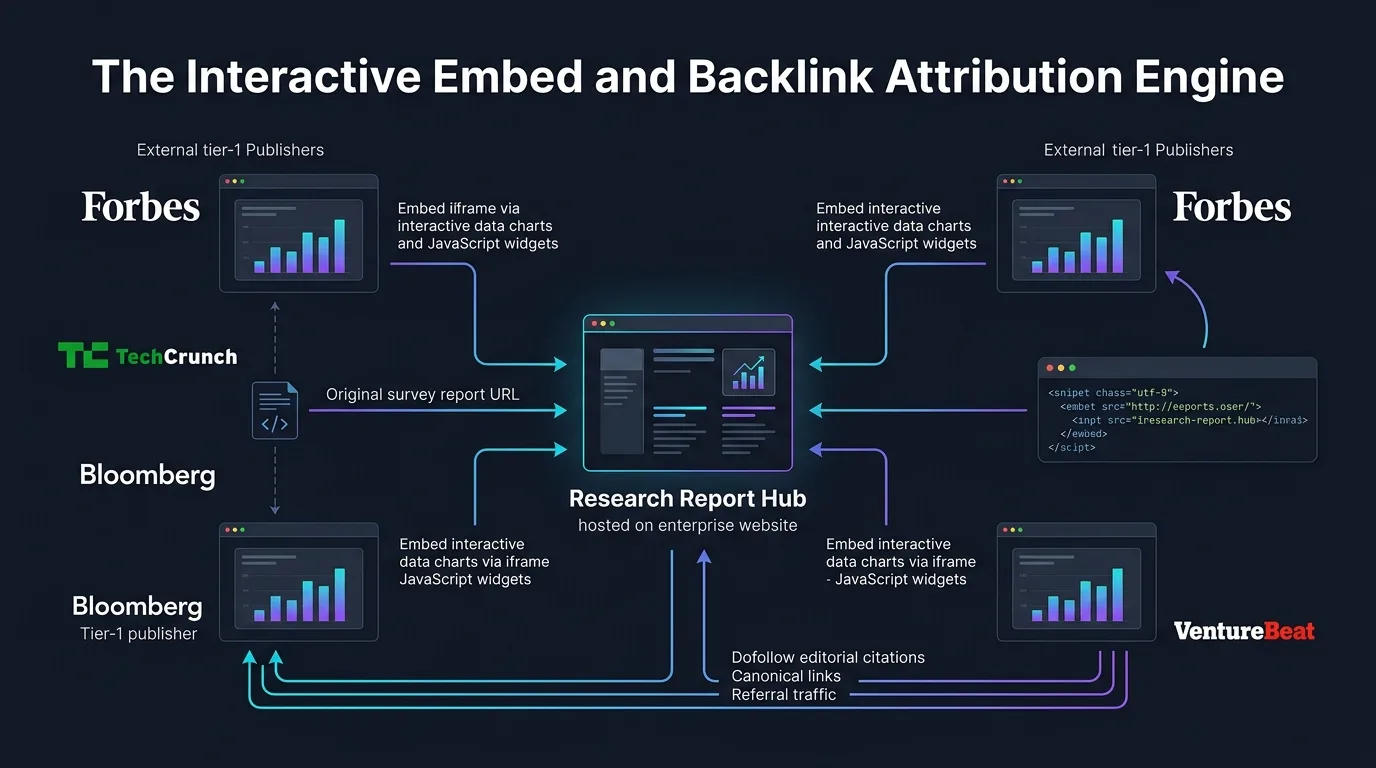
A major secret to securing high-volume, perpetual backlinks is providing frictionless visual assets. Online journalists often lack the time or graphic design resources to build custom charts for breaking news stories. When you provide embeddable, interactive charts and high-resolution downloadable infographics, journalists enthusiastically embed them directly into their articles.
The Triple-Asset Distribution Strategy
For every major survey finding, publish three distinct asset formats on your canonical report page:
- Static High-Resolution PNGs & WebPs: Clean, 16:9 dark-mode and light-mode charts formatted specifically for editorial CMS dimensions (1200x675px). Include a clear source watermark at the bottom:
Source: Seobeen Research / seobeen.com. - One-Click Embed Code Snippets: Provide an HTML copy box allowing editors to embed responsive iframe widgets. The iframe code must include an explicit attribution link directly below the canvas:
<div class="chart-container"> <iframe src="https://example.com/charts/cloud-cost-breakdown" width="100%" height="450" frameborder="0"></iframe> <p style="font-size: 12px; color: #666;">Source: <a href="https://example.com/research/cloud-costs-2026" target="_blank">Enterprise Cloud Cost Benchmark Report 2026</a></p> </div> - Raw Anonymized CSV Dataset: Provide a downloadable CSV or Google Sheets link for academic researchers and data journalists who want to run their own statistical models. Research hubs that share open data earn persistent citations from university domains (.edu) and government policy institutes (.gov).
When constructing technical hubs and responsive data visualizations, optimizing for Core Web Vitals and dynamic server rendering ensures crawler efficiency. For deep implementation tactics, explore our technical breakdown of Next.js App Router SEO for server components and dynamic metadata.

7. High-Converting Pitch Psychology: Vetting Journalists on Muck Rack, X, and Substack
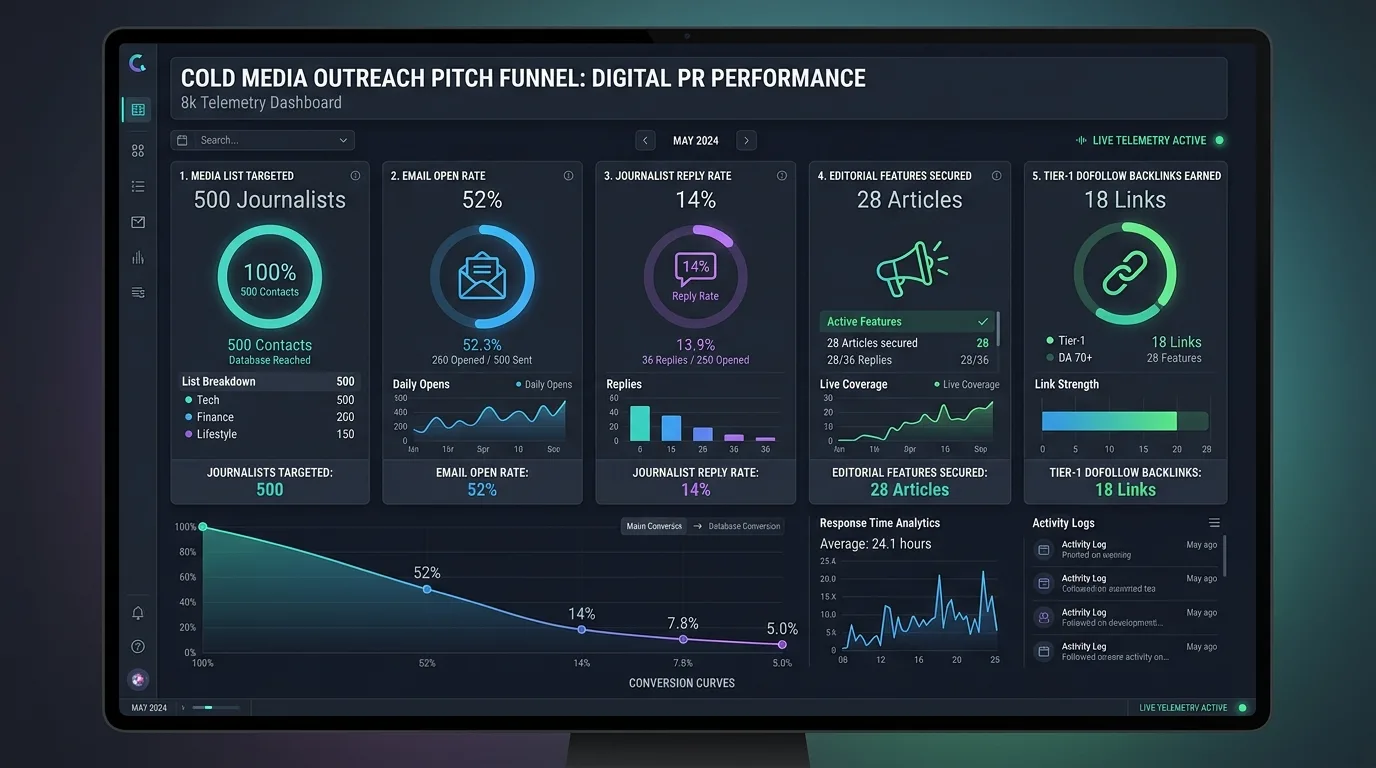
Mass blast emails sent through generic PR distribution wires generate virtually zero editorial links. Modern digital PR requires hyper-targeted, individual journalist engagement. You are far better off pitching 40 meticulously vetted reporters who actively cover your beat than blasting 4,000 random contacts.
Journalist Vetting Criteria
Before adding any journalist to your target media list, confirm three critical criteria:
- Beat Alignment: Have they written about this specific topic within the last 30 to 60 days? (e.g., If pitching cloud cost data, search for reporters who recently covered AWS pricing, enterprise infrastructure, or tech budget cuts).
- Citation Policy: Inspect their recent 5 articles. Do they link out to external primary sources, or does their editorial guidelines mandate stripping all external links? If a publication has an ironclad no-link policy, do not waste your exclusive offer on them.
- Active Social Footprint: Check their recent activity on X (formerly Twitter), Threads, LinkedIn, or Substack. What specific industry arguments or pain points have they commented on recently? Use their recent observations as the opening contextual hook in your email.
The Perfect 150-Word Pitch Template
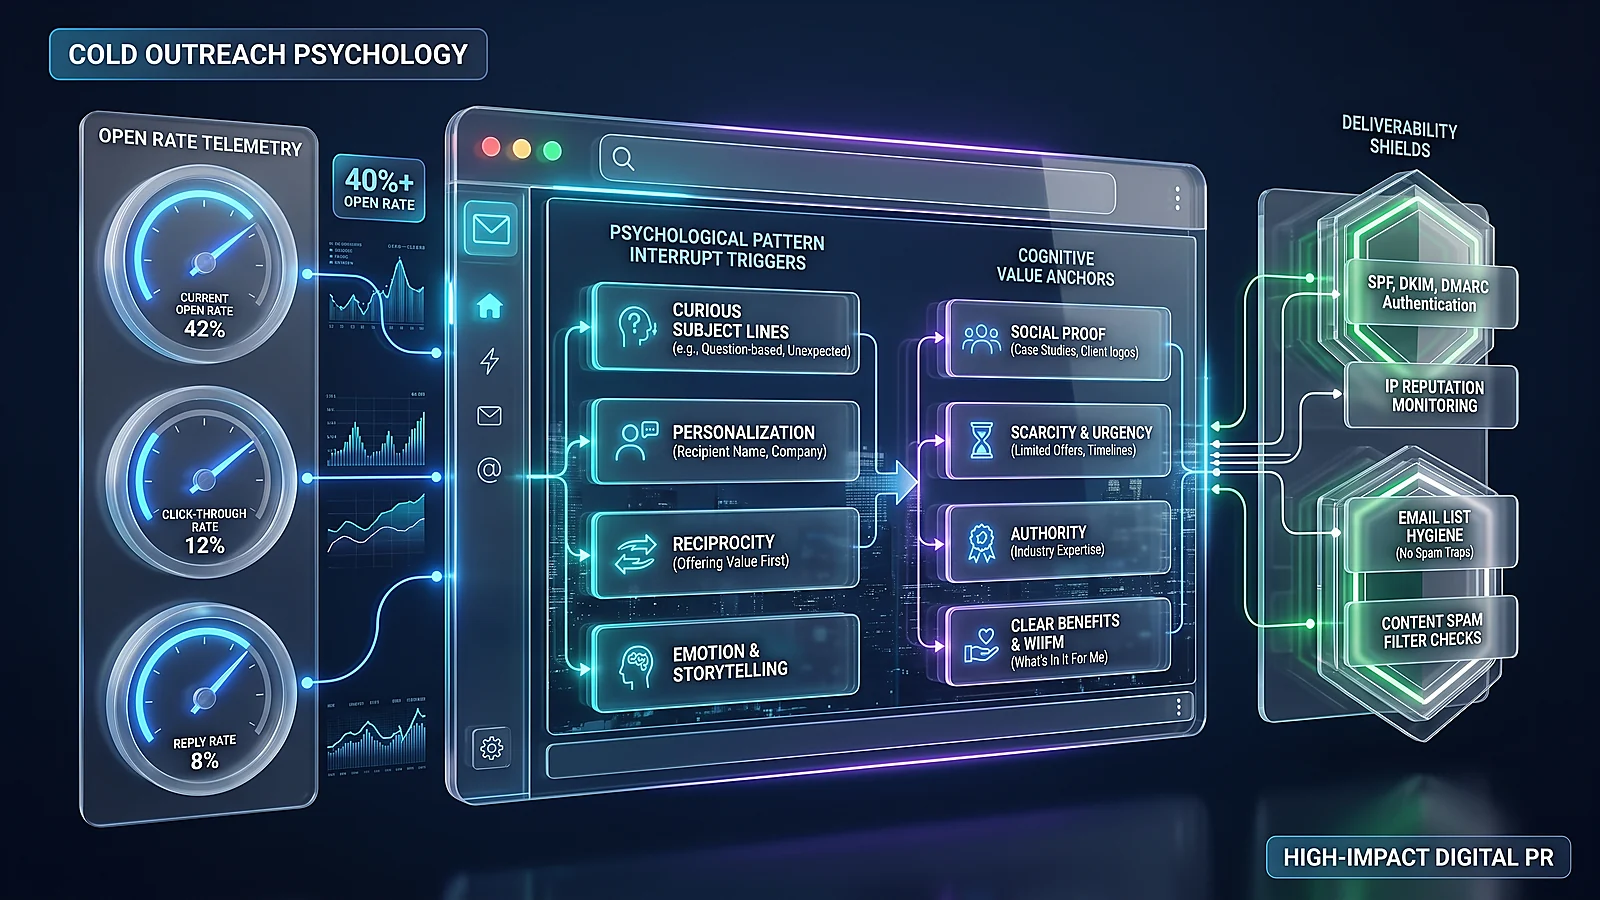
Journalists read emails on mobile devices while commuting or in editorial meetings. If your pitch requires scrolling, it gets deleted. Keep the body text under 150 words:
Subject: Story Pitch: 62% of devs spend more time debugging AI code than writing it (New Study)

Hi [First Name],

Loved your recent piece on [Publication] analyzing developer burnout in the post-copilot era—especially your point regarding code review bottlenecks.

We just completed an independent study of 1,500 senior software engineers across North America and Europe exploring actual deployment velocity after adopting AI coding assistants:

• 62% of engineers report spending more time debugging AI-generated code than writing code manually.
• Technical debt related to AI code hallucinations increased by 44% year-over-year.
• 58% of engineering directors are now instituting mandatory manual code reviews before merging AI PRs.

The full dataset, methodology, and high-res charts are here: [Link to Private Embargo Page]

I'd love to offer [Publication] an exclusive look at the complete research ahead of our public release next Tuesday. Would you be interested in reviewing the raw data or speaking with our VP of Engineering?

Best,
[Your Name]
[Your Title & Organization]
8. The Embargo Strategy vs Exclusive Launch: Orchestrating the Media Drop
How you schedule your launch determines the scale of your press momentum. In digital PR, there are two primary launch mechanisms: the Single Exclusive and the Timed Embargo.
| Strategy | How It Works | Best For | Link Velocity Potential |
|---|---|---|---|
| Single Exclusive | Offer the story to ONE premier journalist 7–10 days before public launch. No one else receives the data until their story goes live. | Major enterprise benchmarks aiming for top-tier publication (Bloomberg, WSJ, TechCrunch). | Extremely high prestige; triggers a cascade of secondary syndication links from other outlets citing the primary story. |
| Timed Embargo | Distribute the complete research to 30–50 targeted beat reporters with a strict agreement: "Embargoed until Thursday, Oct 15 at 9:00 AM EST." | Broad consumer trends, comprehensive annual state-of-the-industry reports, urgent breaking research. | Massive simultaneous spike in backlinks across 15+ publications within a 2-hour window. |
| Public Wire Drop (No Embargo) | Publish directly on your blog and blast out press releases simultaneously. | Minor product updates, localized news, small supplementary data points. | Low editorial uptake; journalists hate covering news that has already been published elsewhere. |
For high-stakes SEO impact, the Exclusive-to-Syndication Waterfall delivers the highest ROI. Secure a commitment from a tier-1 flagship outlet (e.g., TechCrunch). The moment their article is published with your canonical link, immediately dispatch your pitch to tier-2 trade publications, industry newsletters, and specialized podcasts: "As reported in TechCrunch this morning, our new data revealed...". Journalists at secondary publications feel safe citing stories that have already been validated by tier-1 editors.
9. Turning Brand Mentions into Editorial Dofollow Backlinks at Scale
Even with outstanding data, approximately 20% to 35% of journalists who cover your research will mention your brand name ("according to a recent study by Seobeen...") without including an active clickable hyperlink. While Google's Knowledge Graph recognizes unlinked brand citations as entity co-occurrences, transforming those unlinked mentions into dofollow hyperlinks transmits vital PageRank equity.
The Polite Value-Add Reclamation Script
Never send aggressive legal demands or generic "please give me a link" requests. Frame the reclamation as a service to their readers:
Subject: Quick note regarding your coverage of our engineering research / reader resource

Hi [First Name],

Thank you so much for featuring our developer survey in your recent article on [Article Title]! Really appreciated how you highlighted the discrepancy between AI code generation and debugging hours.

I noticed you referenced the study findings in paragraph 4. If you think it would be helpful for your readers who want to explore the full demographic breakdown or download the open-source charts, here is the direct link to the research hub: [URL]

Either way, thank you again for the fantastic coverage!

Best regards,
[Your Name]
This courteous, reader-first approach achieves a conversion rate exceeding 45%. Because the journalist already likes your work enough to quote your numbers, adding an attribution hyperlink is a trivial 10-second CMS update for them.
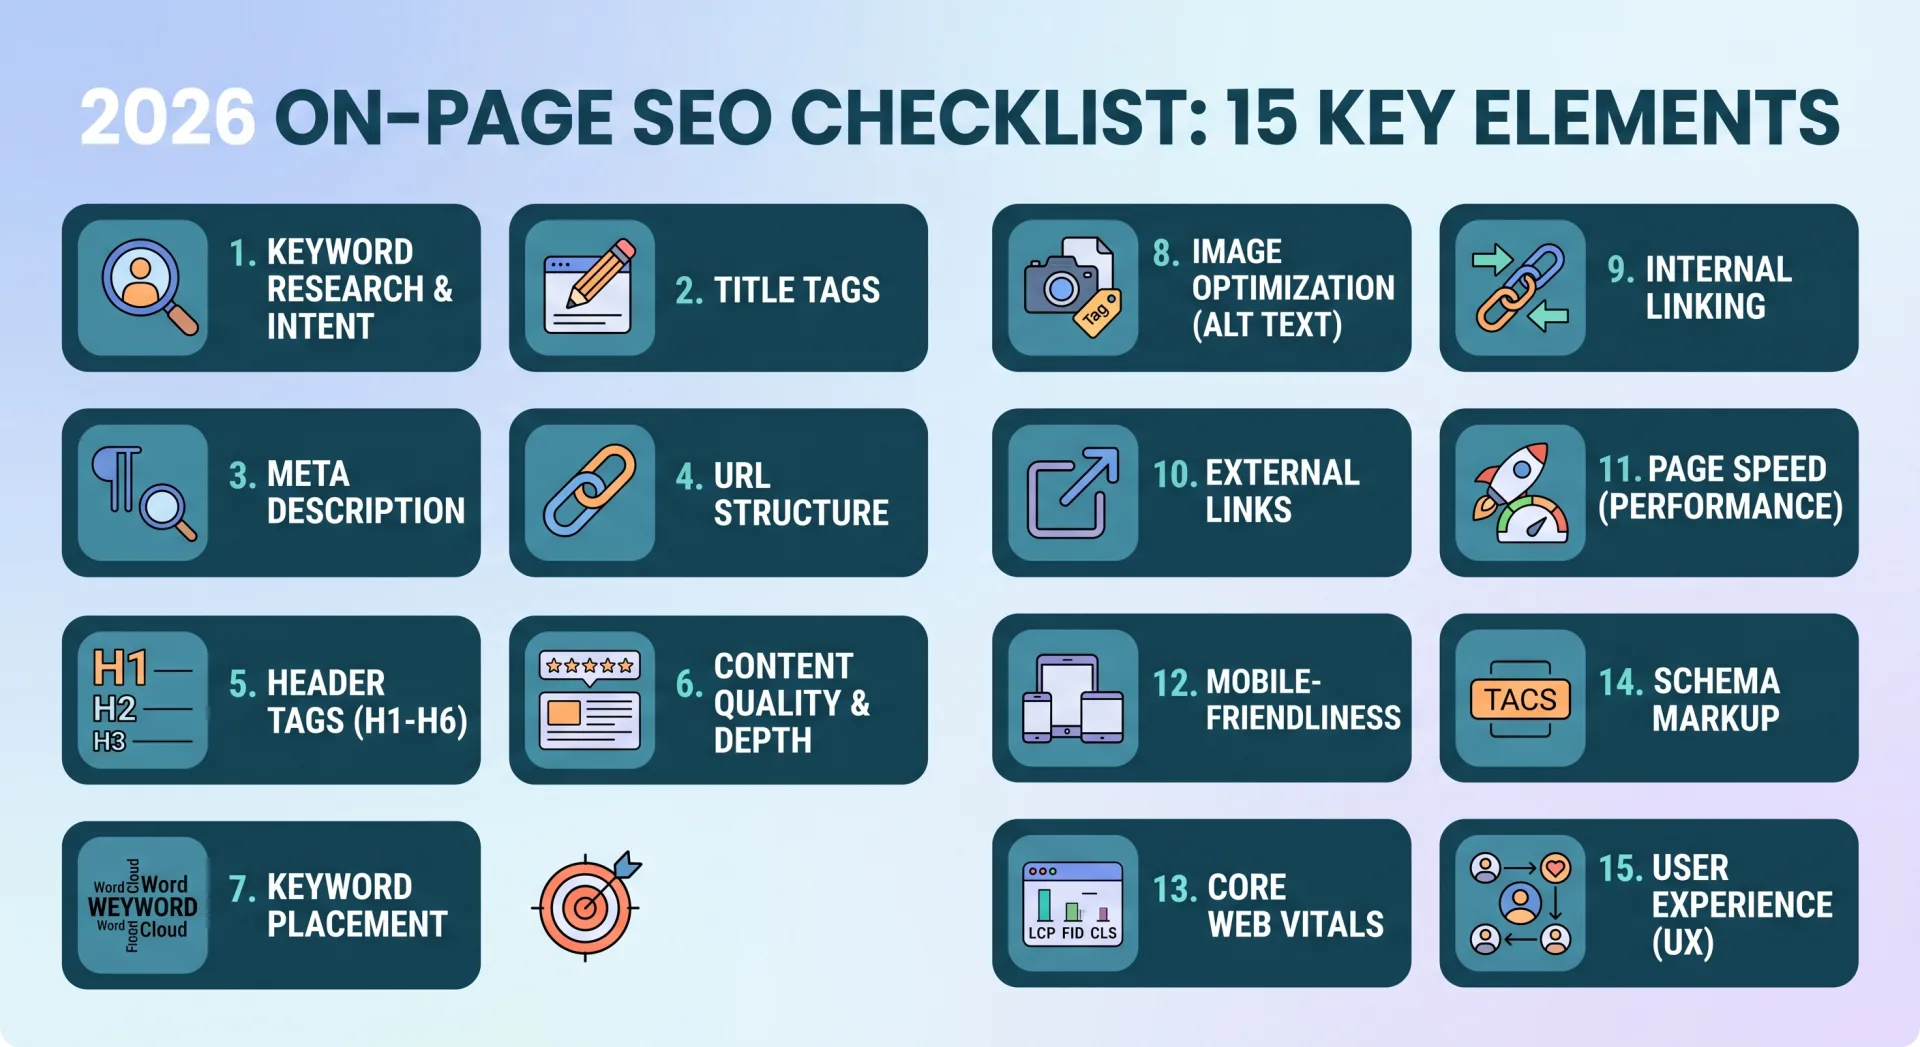
To ensure your on-page architecture is primed to retain and distribute this newly acquired link equity throughout your domain, consult our master guide on on-page SEO mastery and semantic relevance.
10. Frequently Asked Questions
Explore actionable answers to common enterprise questions about data-driven journalism, statistical survey design, and digital PR link building.
How much does it cost to conduct an authoritative 1,500-respondent industry survey?
Using reputable research sample panels like Prolific, Censuswide, or Cint, a general consumer survey of 1,500 respondents typically costs between $2,500 and $4,500. A highly specialized B2B survey (e.g., verified DevOps managers, doctors, or Fortune 1000 executives) requires higher respondent compensation, typically ranging from $6,000 to $15,000. When compared to the cost of purchasing low-quality paid links that risk algorithmic penalties, a single data study that earns 40+ tier-1 editorial links delivers an unmatched cost-per-link ROI.
Can we survey our own customer database instead of hiring an external panel?
You can, but you must be transparent. Surveys of proprietary user bases are prone to selection bias because your existing customers already favor your methodology and product ecosystem. For internal data to be cited by top journalists, frame it as proprietary product telemetry (e.g., "Analysis of 50M anonymized database queries across our cloud infrastructure") rather than a general industry survey.
What is an embargo in PR and is it legally binding?
An embargo is an agreement between a source and a journalist that provided information will not be published until a specified date and time. It is not a legally binding contract, but an ethical pact. Professional journalists adhere strictly to embargoes because breaking them results in blacklisting by PR agencies, corporate executives, and press networks.
How long before launch should I pitch an exclusive to a journalist?
Pitch your exclusive 7 to 10 business days prior to your target launch date. Tier-1 investigative and business reporters need time to review raw datasets, interview external industry analysts for third-party commentary, and receive sign-off from their managing editor.
What do I do if a journalist covers our data but doesn't include a link?
Execute an unlinked brand mention reclamation workflow. Send a polite, complimentary email within 24 to 48 hours of publication thanking them for the coverage and offering a direct link to the canonical research report so their readers can verify the methodology or view the interactive charts.
How many questions should an industry survey contain?
Optimal completion rates occur when surveys contain between 12 and 18 questions and take no longer than 5 to 7 minutes to finish. Surveys exceeding 20 questions suffer steep respondent fatigue, leading to careless click-through answers and compromised statistical integrity.
Are nofollow or rel="sponsored" links from news sites still valuable for SEO?
Yes, immensely so. While rel="sponsored" indicates paid advertorials, standard editorial nofollow links from publications like Forbes or Wired are treated by Google as algorithmic hints under its link attribution framework. More importantly, tier-1 media coverage generates massive referral traffic, drives secondary citations from bloggers who use standard dofollow links, and reinforces entity authority in Google's Knowledge Graph.
What tools should we use to find journalist contact information?
Muck Rack, Cision, and Roxhill are the industry gold standards for enterprise PR databases. For agile teams, tools like Hunter.io, RocketReach, and specialized Google search operators paired with LinkedIn and X provide highly accurate direct editorial email addresses.
How do we prevent our survey report page from looking like a promotional sales pitch?
Segregate your research from your product marketing. Host your study on an editorial subdomain or dedicated research directory (e.g., /research/ or /reports/). Avoid intrusive lead gates, popups, or aggressive "Book a Demo" banners on the primary data page. If journalists feel your report is a gated lead-generation trap, they will refuse to link to it.
How often should an enterprise brand publish original research?
The optimal cadence for enterprise teams is one flagship benchmark report per year (e.g., "The Annual State of Enterprise Cloud Security") supplemented by 2 to 3 smaller, agile pulse surveys (N=500–1,000) that capitalize on timely breaking industry events or controversial debates.
Ratings & reviews
No reviews yet. Be the first.