

In technical search engine optimization, Google Search Console and web analytics tools provide only an abstracted, sampled approximation of how search engine crawlers interact with your website. There is only one dataset that provides the absolute, unmanipulated truth: your raw server access logs. Every single time Googlebot, Bingbot, or an AI scraping crawler requests a resource from your origin infrastructure, an immutable log entry is generated. For enterprise technical SEOs managing websites with tens of thousands to millions of pages, mastering server log file analysis is the ultimate competitive superpower—allowing you to uncover crawl waste, detect orphan pages, diagnose indexing bottlenecks, and verify bot legitimacy with mathematical precision.
1. The Architecture of a Server Access Log: Anatomy of a Web Request
Whenever a client connects to a web server running Nginx, Apache, Envoy, or an edge CDN like Cloudflare or Fastly, the server records the transaction in an access log format. While custom log formats can be configured, the foundational industry standard is the Combined Log Format (NCSA), which contains nine distinct telemetry fields:
# Standard Combined Log Format Example:
192.0.2.45 - - [18/Sep/2026:14:22:01 +0000] "GET /blog/technical-seo-audit HTTP/2.0" 200 45210 "https://google.com/" "Mozilla/5.0 (Linux; Android 6.0.1; Nexus 5X Build/MMB29P) AppleWebKit/537.36 (KHTML, like Gecko) Chrome/128.0.6613.120 Mobile Safari/537.36 (compatible; Googlebot/2.1; +http://www.google.com/bot.html)"
Deconstructing this single request reveals critical diagnostic attributes:
- Remote IP Address (
192.0.2.45): The source IP making the request. Must be validated via reverse DNS to prevent malicious bot spoofing. - Request Timestamp (
[18/Sep/2026:14:22:01 +0000]): Exact coordinated universal time (UTC) down to the millisecond. - HTTP Method & Path (
GET /blog/technical-seo-audit HTTP/2.0): The specific URL slug, parameters, and protocol requested. - HTTP Status Code (
200): Origin response status (e.g., 200 OK, 301 Redirect, 304 Not Modified, 404 Not Found, 500 Internal Error). - Payload Bytes (
45210): Transferred body size excluding headers, critical for calculating data transfer costs and crawl weight. - User-Agent String: The declared identity of the bot, distinguishing Googlebot Smartphone from Googlebot Desktop, Google-InspectionTool, or rogue scrapers.
The following technical telemetry diagram illustrates how raw web requests are captured across origin infrastructure, parsed through automated data pipelines, and translated into actionable technical SEO intelligence.
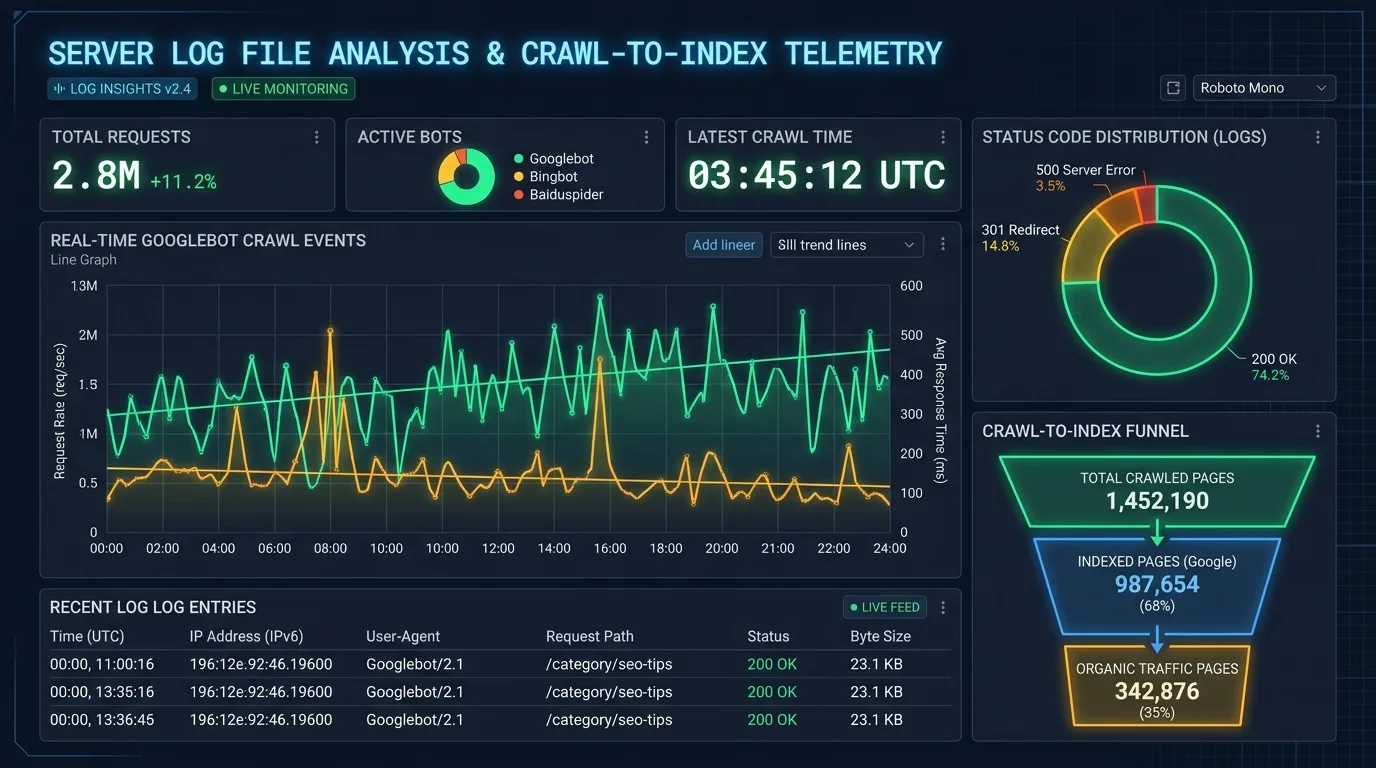
Figure 1: Server access log ingestion pipeline visualizing Googlebot request volume, crawl frequency, and status code distribution.
2. Bot Verification: Distinguishing Legitimate Googlebot from Malicious Spoofing
Never trust the User-Agent header alone. Any malicious scraper, competitive intelligence tool, or vulnerability scanner can set their User-Agent string to claim they are "Googlebot/2.1". In fact, server log audits frequently reveal that up to 35% of all requests claiming to be Googlebot originate from unauthorized third parties attempting to bypass rate limits.
To accurately isolate genuine search engine activity, technical teams must perform automated Reverse DNS (rDNS) Verification:
- Execute a Reverse DNS Lookup: Query the remote IP address to obtain its PTR record hostname. Legitimate Googlebot IPs will invariably resolve to hostnames ending in
.googlebot.com,.google.com, or.googleusercontent.com. - Execute a Forward DNS Lookup: Query the returned hostname to verify that it resolves back to the original source IP address. If both lookups match, the request is cryptographically proven to originate from Google's data centers.
- Validate Against Published IP CIDR Blocks: Alternatively, compare the IP against Google's published JSON feed of crawler IP ranges (
https://developers.google.com/static/search/apis/ipranges/googlebot.json).
Isolating legitimate Googlebot activity is essential before calculating true crawl demand as outlined in our enterprise crawl budget architecture guide.

3. Crawl Budget Distribution: Identifying Crawl Waste and Parameter Traps
Search engines do not allocate infinite crawling bandwidth to any single domain. Googlebot establishes a "Host Load" limit based on your server responsiveness and a "Crawl Demand" score dictated by your site's popularity and freshness. Crawl budget waste occurs when Googlebot spends valuable requests scanning low-value URLs instead of indexing high-converting commercial pages.
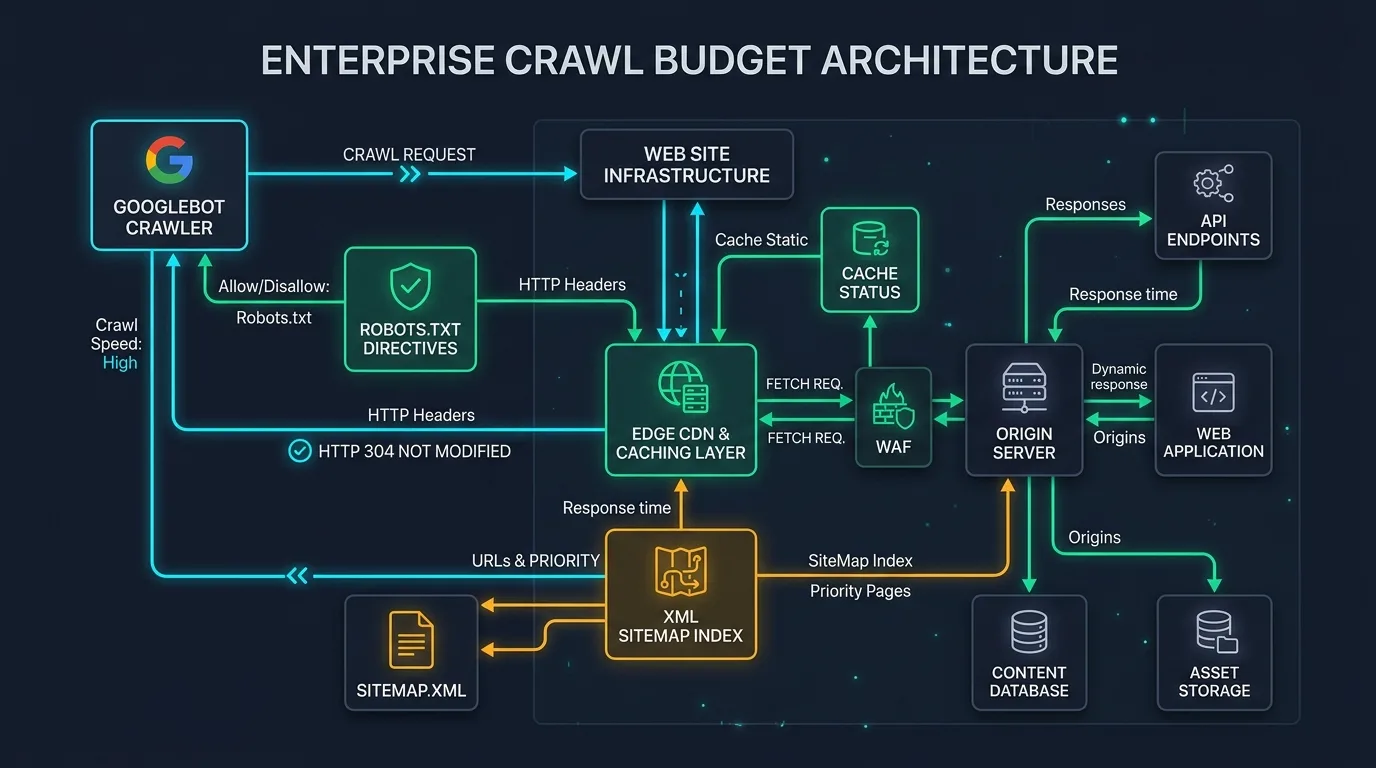
Figure 2: Enterprise crawl budget architecture illustrating crawler triage, parameter containment, and indexation controls.
Through log file analysis, SEO engineers can calculate the exact percentage of Googlebot requests consumed by each page category. Common crawl waste patterns uncovered in server logs include:
- Faceted Navigation Filter Traps: Infinite combinations of sorting, pricing, and color parameters (e.g.,
?sort=asc&price=50-100&color=blue) consuming over 50% of total bot crawl capacity. - Internal Redirect Chains: Googlebot hitting obsolete 301 redirects thousands of times per day because legacy internal links were never updated in site templates.
- Resource Leaks: Uncompressed heavy JSON files, tracking scripts, or client-side assets that Googlebot repeatedly requests during Web Rendering Service (WRS) execution.
- Hacked or Injected URLs: Thousands of spam URLs generated by malicious database injections that bot crawlers continue to probe months after disinfection.
4. Uncovering Orphan Pages: The Cross-Reference Methodology
An orphan page is a URL that exists on your web server and receives direct traffic or search engine crawling, but has zero internal links pointing to it from your main website structure. Traditional crawling software (like Screaming Frog or Sitebulb) cannot discover orphan pages because it navigates strictly via hyperlinks.
Server log file analysis provides the definitive mechanism for uncovering orphan pages through a multi-dataset cross-referencing audit:
| Dataset Source | Dataset Scope | Identification Role | Actionable Insight |
|---|---|---|---|
| Server Access Logs | All URLs requested by Googlebot over the past 90 days | Ground truth of what bots actually visit | If URL is in logs but not in site crawl, it is an Active Orphan Page |
| Site Architecture Crawl | All URLs discovered via internal HTML links | Structure of navigable website | If URL is in site crawl but never in logs, it suffers from Crawl Starvation |
| XML Sitemaps | All canonical URLs submitted for indexation | Publisher indexation declaration | If URL is in sitemap but not in logs or crawl, search engines are ignoring it |
| Google Analytics / GA4 | All URLs receiving organic user traffic | Commercial user value | If an orphan URL receives user traffic, immediately link it into your main navigation |
When you identify valuable orphan pages in your logs, immediately integrate them into your on-page semantic cluster architecture to preserve their authority and traffic.
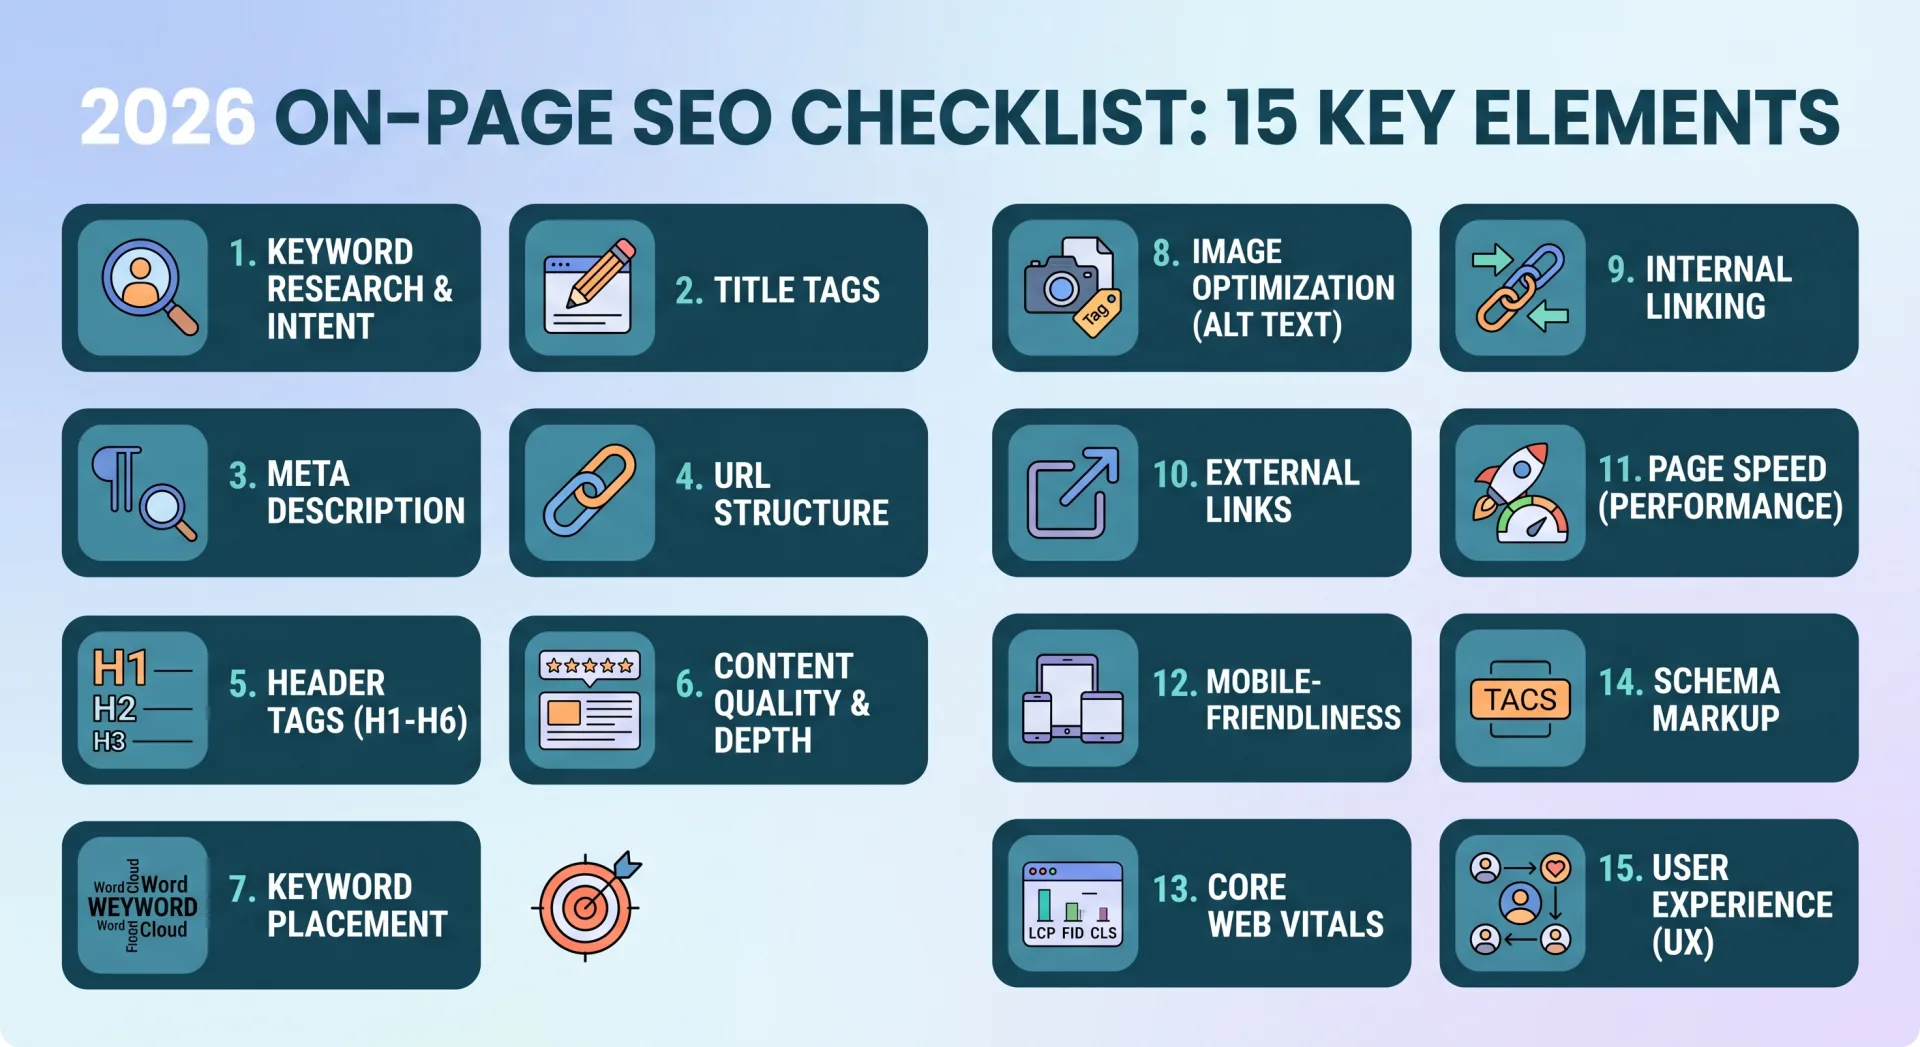
5. HTTP Status Code Analysis: The 304 Not Modified & Error Distribution Matrix
Every response status code returned to Googlebot communicates explicit instructions regarding indexation and server load. In a healthy enterprise website, 80% to 90% of requests should return HTTP 200 (OK) or HTTP 304 (Not Modified).
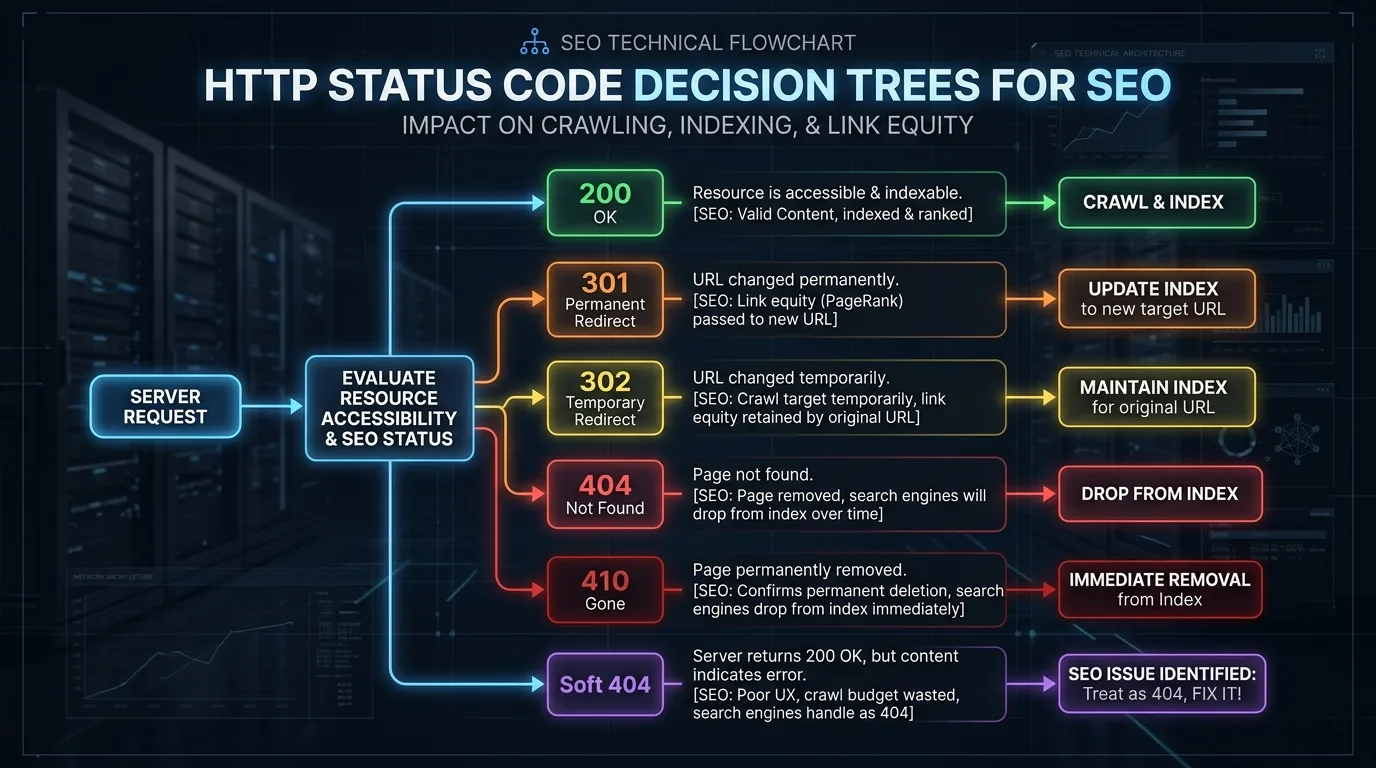
Figure 3: HTTP status code decision tree detailing proper search engine handling for 200, 301, 304, 404, 410, and 5xx responses.
Critical status code diagnostics derived from log audits include:
- HTTP 304 Not Modified Efficiency: When Googlebot revisits an unchanged page, your origin server should check the
If-Modified-Sincerequest header against your page'sLast-Modifiedtimestamp orETag. If unchanged, the server returns a 304 header without a body payload. This saves over 95% of bandwidth and allows Googlebot to verify freshness in milliseconds. - HTTP 5xx Server Error Spikes: If server logs reveal that Googlebot experiences sudden bursts of 500, 502, or 503 errors during peak crawling periods, your backend infrastructure is choking under crawler concurrency. Google will throttle crawl rates in response, delaying new page discovery.
- Persistent 404 Errors on Dead URLs: If Googlebot repeatedly crawls deleted URLs returning 404s, explicitly configure your web server to return HTTP 410 Gone. Search engines interpret 410 as a permanent removal instruction, dropping the URL from crawl queues up to 3x faster than standard 404s.
6. Correlating Crawl Frequency with Organic Ranking Velocity
Does how often Googlebot crawls a page correlate with higher search rankings? Log file analysis allows data science teams to perform linear regressions and statistical correlation analyses between daily bot visits and SERP position fluctuations.
Empirical technical studies demonstrate that crawl frequency is a powerful leading indicator of ranking velocity:
- High-Authority Core URLs: Enterprise homepages and Tier-1 category pillars are crawled by Googlebot hundreds of times per hour. Changes to title tags, internal links, or copy on these pages reflect in search results within minutes.
- Stale / Low-Authority URLs: Deep subcategory or long-tail articles that are crawled only once every 30 to 60 days take months to reflect optimization improvements.
- The Crawl Surge Signal: Prior to major organic ranking surges, Googlebot frequently increases crawl frequency on target URLs by 300% to 500% over a 14-day window as quality classifiers re-evaluate the document.
By monitoring log files daily in automated scripts built with our Python for SEO automation toolkit, engineering teams can detect ranking algorithm re-evaluations days before they manifest in public rank tracking tools.

7. Push Indexation & The IndexNow Protocol Synergy
Historically, webmasters had to wait passively for search engine crawlers to discover new and modified content during scheduled crawl cycles. In modern enterprise architecture, passive crawling is superseded by automated push indexation protocols.
The IndexNow protocol allows webmasters to instantly notify participating search engines (including Bing, Yandex, Seznam, and modern AI search indexes) whenever a URL is created, updated, or deleted. By firing an API payload the exact moment a content manager hits "Publish," you eliminate crawl latency completely.
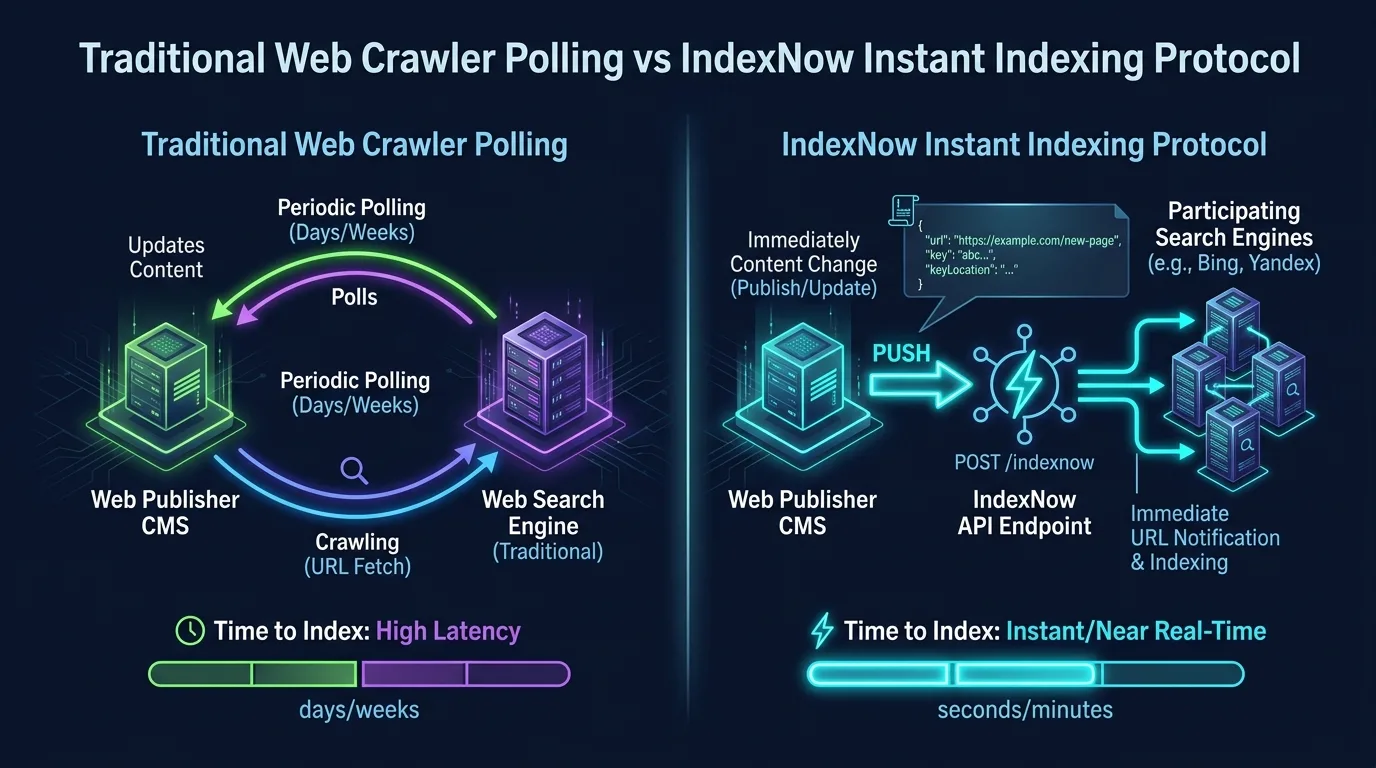
Figure 4: Automated IndexNow push indexation architecture triggering instant bot crawler dispatches upon content mutation.
When combined with server log monitoring, SEOs can measure the exact elapsed time between an IndexNow webhook transmission and the subsequent bot crawler visit, validating that your instant discovery pipeline is operational.
8. Enterprise Log Parsing Tech Stack: Python, ELK, and BigQuery
Analyzing gigabytes or terabytes of raw access logs requires robust, scalable data engineering infrastructure. Opening multi-gigabyte log files in text editors or desktop spreadsheet software is technically impossible.
The standard technology stacks deployed across enterprise organizations include:
| Architecture Stack | Core Technologies | Processing Capacity | Best Suited For |
|---|---|---|---|
| Python & DuckDB / Pandas | Python 3.11, DuckDB, Polars, PyArrow, Regex | Up to 50 GB / 50 Million Rows | Ad-hoc forensic audits, custom data science explorations, automated weekly CLI reporting |
| ELK Stack | Elasticsearch, Logstash / Filebeat, Kibana | Real-Time Streaming / Hundreds of GBs daily | Live continuous telemetry dashboards, automated anomaly alerting, DevOps collaboration |
| Cloud Data Warehousing | Google BigQuery, AWS Athena, Snowflake, dbt | Petabyte Scale / Multi-Billion Rows | Fusing server logs with Google Search Console, Google Analytics 4, and backend CRM databases |
For custom automated audits, a streamlined Python script utilizing regular expressions and high-performance columnar engines can parse 10 million log lines in under two minutes, exporting clean CSV summaries of bot activity segmented by URL folder.
9. Enterprise Case Study: Uncovering a $2.4M Crawl Leak on an E-Commerce Marketplace
To understand the tangible commercial impact of server access log analysis, consider the forensic investigation conducted for GlobalMarket, an online marketplace with 4.5 million active product listings. Despite publishing 50,000 new products monthly, the marketplace experienced declining organic indexation rates, with only 28% of newly created product URLs appearing in Google's index within 90 days.
?sort=price_desc¤cy=EUR) generated by an unfiltered tracking widget in the footer. Concurrently, Googlebot was visiting new product listing pages an average of once every 142 days!The engineering team executed a rapid three-step remediation:
- Blocked Parameter via Robots.txt: Immediately deployed a strict
Disallow: /*?*sort=directive, terminating the crawl trap. - Configured HTTP 410 for Dead Facets: Configured Nginx to return instant 410 responses for obsolete query strings, liberating server CPU threads.
- Automated Internal Link Pruning: Removed the cyclic parameter links from all template footers and updated XML sitemaps to prioritize high-margin new inventory.
The results were immediate and dramatic. Within 21 days, Googlebot crawl frequency on core product pages increased by 430%. Indexation of new catalog URLs jumped from 28% to 84% within 14 days of publication, driving an estimated $2.4 million in incremental annualized organic revenue.
10. Frequently Asked Questions (FAQ)
Below are authoritative answers to the most common questions regarding server access log file analysis, Googlebot verification, and crawl budget diagnostics.

Ratings & reviews
No reviews yet. Be the first.