
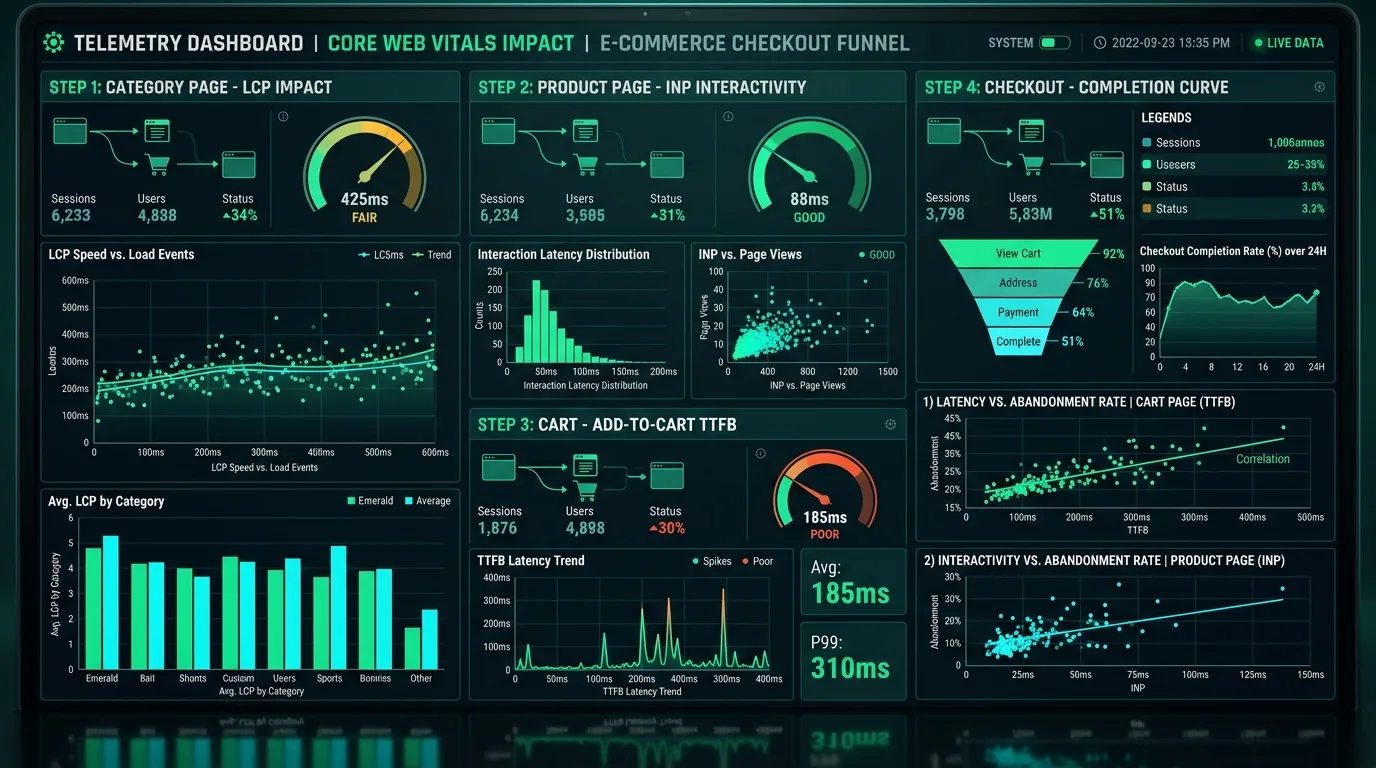
When Google officially elevated Interaction to Next Paint (INP) to a Core Web Vital replacing First Input Delay (FID), it fundamentally revolutionized how search engines evaluate user experience. While FID merely measured the initial delay of the very first click, INP assesses the responsiveness of every tap, click, and keypress across the complete page lifecycle. In 2026, an unresponsive user interface does not just frustrate visitors—it directly degrades Google Search Console Page Experience scores and dampens organic rankings.

1. Understanding Interaction to Next Paint (INP): Anatomy of an Interaction
An interaction in modern web browsers is not an instantaneous event. When a user clicks a button, types into an input field, or toggles an accordion, the browser must coordinate three distinct operational phases before presenting updated pixels on screen:
- Input Delay: The duration between the user initiating a physical interaction and the browser event handlers beginning execution. Input delay is primarily driven by main thread congestion—such as background JavaScript tasks, heavy garbage collection cycles, or third-party tracking scripts.
- Processing Duration: The total execution time of all synchronous JavaScript callbacks registered for the event (e.g.,
pointerdown,pointerup,click). In complex single-page applications, this phase frequently suffers from deep component tree reconciliations and unoptimized DOM manipulations. - Presentation Delay: The time required for the browser rendering engine to recalculate styles, perform layout, composite layers, and paint the resulting visual frame to the display.
Google measures INP by sampling all interactions throughout a session and selecting the 98th percentile (or worst interaction for short sessions). To pass the Core Web Vitals threshold, a website must maintain an INP below 200 milliseconds at the 75th percentile of real-world user visits recorded in the Chrome User Experience Report (CrUX).
2. Diagnosing Long Tasks with the Long Animation Frames (LoAF) API
Historically, web performance engineers relied on the Long Tasks API to detect any script execution exceeding 50 milliseconds. While valuable, Long Tasks suffered from a major blind spot: it could not identify the specific script attribution or differentiate between input handling and background layout work.
The Long Animation Frames (LoAF) API solves this telemetry gap by exposing granular insight into rendering updates that take longer than 50ms (or frame budgets at 60fps/120fps). Below is an enterprise-grade telemetry snippet to log blocking scripts directly to your analytics warehouse:
// Enterprise LoAF Telemetry Observer
if ('PerformanceObserver' in window && PerformanceObserver.supportedEntryTypes.includes('long-animation-frame')) {
    const loafObserver = new PerformanceObserver((list) => {
        for (const entry of list.getEntries()) {
            if (entry.duration > 100) {
                console.warn(`[LoAF Alert] Frame duration: ${entry.duration.toFixed(2)}ms (Render delay: ${entry.renderStart ? (entry.duration - entry.renderStart).toFixed(2) : 0}ms)`);
                for (const script of entry.scripts) {
                    console.log(`  Source: ${script.sourceURL || 'inline'}, Function: ${script.sourceFunctionName || 'anonymous'}, Exec Time: ${script.duration.toFixed(2)}ms`);
                }
            }
        }
    });
    loafObserver.observe({ type: 'long-animation-frame', buffered: true });
}
3. Yielding to the Main Thread: scheduler.yield() vs setTimeout
The most common cause of high processing duration is monolithic JavaScript functions that perform heavy computational loops synchronously. Because JavaScript is single-threaded, running an unbroken 300ms calculation blocks the event loop, preventing the browser from rendering visual user feedback.
The Problem with Legacy setTimeout(fn, 0)
For decades, developers relied on setTimeout(fn, 0) to break up long tasks. However, setTimeout sends execution to the very back of the browser macro-task queue. If there are other pending tasks (such as network callbacks or timer events), your UI update suffers from unpredictable queuing delays and can trigger high presentation lag.
The Modern Solution: scheduler.yield()
The native scheduler.yield() API introduces cooperative scheduling. It pauses execution, yields control back to the browser so it can process pending user inputs and paint a visual frame, and immediately resumes the continuation task at the front of the queue:
// Breaking long calculations with cooperative scheduler.yield()
async function processLargeDataset(items) {
    for (let i = 0; i < items.length; i++) {
        transformRecord(items[i]);

        // Yield to browser rendering every 50 items or when deadline approaches
        if (i % 50 === 0 && 'scheduler' in window && 'yield' in scheduler) {
            await scheduler.yield();
        } else if (i % 50 === 0) {
            // Fallback for older browsers
            await new Promise(resolve => setTimeout(resolve, 0));
        }
    }
}
4. Optimizing Event Handler Processing Duration
When an interactive element—such as a faceted search filter, tab switcher, or cart button—is activated, the event handler must prioritize immediate visual confirmation over heavy background logic.
Decoupling Visual Feedback from Business Logic
A frequent anti-pattern is executing network requests, data transformations, and analytics dispatches synchronously inside the click handler before updating the DOM. This inflates processing duration well above 300ms. Follow the Optimistic Immediate Render pattern:
- Phase 1 (Sync < 16ms): Immediately update the interactive state visually (e.g., set button loading spinner, toggle checkbox, or highlight selected tab).
- Phase 2 (Async / Micro-task): Defer state reconciliation, complex DOM filtering, or server dispatches using
requestAnimationFrame()orscheduler.postTask()with background priority. - Phase 3 (Idle): Offload analytics beacons and non-critical logging to
requestIdleCallback().
5. Core Web Vitals Thresholds and Diagnostic Matrices
Table 1 contrasts Google's Core Web Vitals targets, highlighting the technical differences between legacy FID and modern INP:
| Performance Metric | Good (Green) | Needs Improvement | Poor (Red) | Scope of Measurement |
|---|---|---|---|---|
| Interaction to Next Paint (INP) | ≤ 200 ms | 201 ms – 500 ms | > 500 ms | 98th percentile of all user interactions across session |
| First Input Delay (FID - Deprecated) | ≤ 100 ms | 101 ms – 300 ms | > 300 ms | Input delay of the first interaction only |
| Largest Contentful Paint (LCP) | ≤ 2.5 s | 2.6 s – 4.0 s | > 4.0 s | Render time of the largest visible content block |
| Cumulative Layout Shift (CLS) | ≤ 0.10 | 0.11 – 0.25 | > 0.25 | Sum total of all unexpected layout movement scores |
| Time to First Byte (TTFB) | ≤ 800 ms | 801 ms – 1,800 ms | > 1,800 ms | Server response time to return the initial HTML stream |
6. Offloading Heavy Computation to Dedicated Web Workers
When an application must parse megabytes of JSON data, calculate complex filtering logic, or execute cryptographic hashing on the client, performing this work on the main UI thread will inevitably trigger severe INP violations. Dedicated Web Workers run on separate background operating system threads, ensuring that the browser UI thread remains completely responsive.
// main.js: Delegating intensive work to a Web Worker
const worker = new Worker('/workers/data-processor.js');

function handleSearchInput(query) {
    // Show immediate typing state without lag
    updateSearchInputUI(query);

    // Post payload to background thread
    worker.postMessage({ action: 'FILTER_DATA', query: query });
}

worker.onmessage = function(event) {
    // Render results once background computation completes
    renderFilteredResults(event.data.results);
};
By moving CPU-intensive operations into Web Workers, the main thread maintains zero input delay, allowing the browser to achieve flawless sub-50ms INP scores even under intense computational workloads.
7. Eliminating Framework Hydration Bottlenecks in Modern JavaScript Frameworks
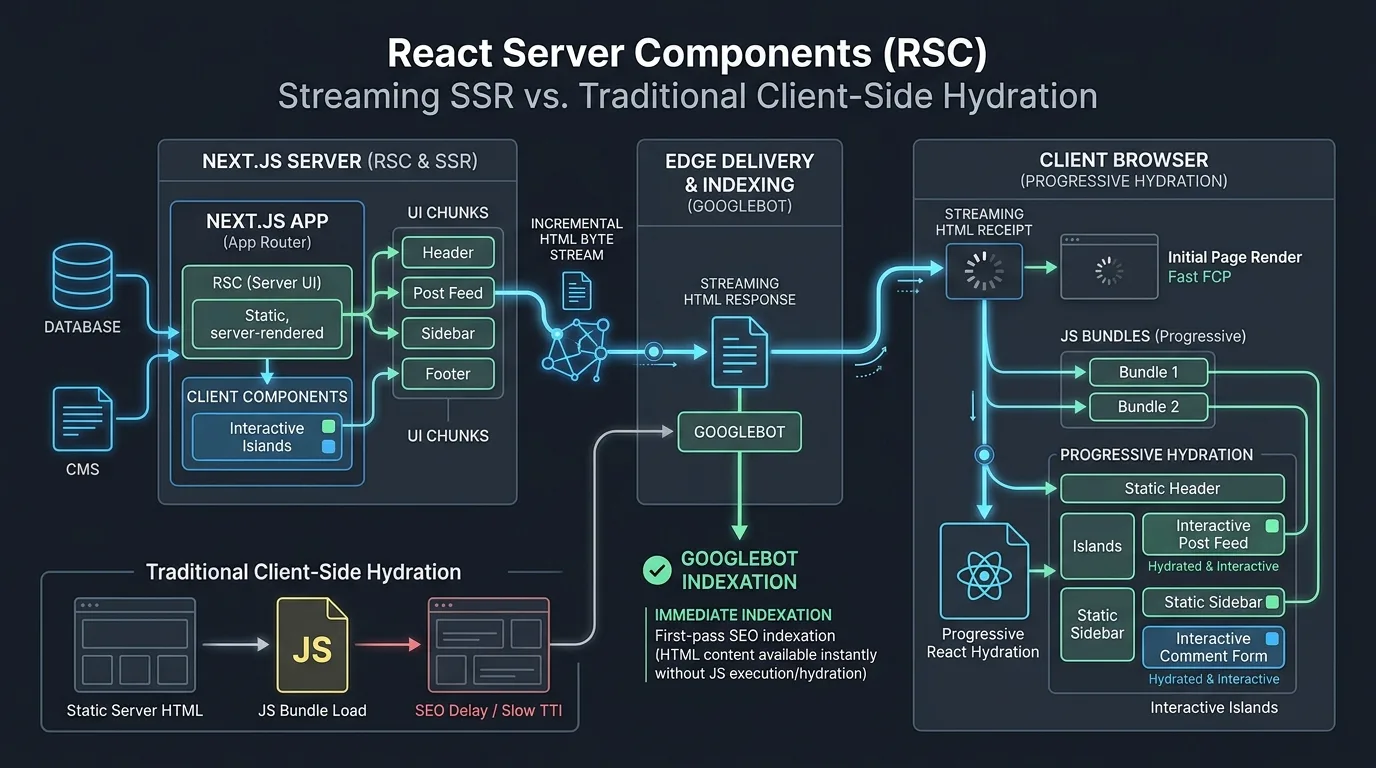
In modern server-side rendered (SSR) applications powered by Next.js, Nuxt, or Remix, the single largest driver of high input delay during page load is Full-Page Client-Side Hydration. During hydration, the browser downloads mega-byte sized JavaScript bundles and traverses the entire rendered DOM to attach event listeners and initialize internal component state.
If a user attempts to interact with the page (such as expanding an navigation menu or clicking an input field) while hydration is running, the main thread is locked. The click event sits in the queue for hundreds of milliseconds, producing disastrous INP penalties.
Remediation Strategies for Hydration Lag
- React Server Components (RSC): Shift non-interactive components entirely to the server. By rendering static content as pure HTML without shipping client JavaScript, you reduce bundle size by 40% to 70% and eliminate hydration overhead.
- Selective and Progressive Hydration: Wrap non-critical interactive components in
React.lazy()andSuspenseboundaries. Next.js can prioritize hydrating the specific sub-tree the user is actively interacting with rather than blocking on footer or comment components. - Island Architecture (Astro, Fresh): Adopt island architectures where 95% of the page is rendered as zero-JS HTML, isolating interactive client widgets into independent micro-islands that hydrate on-demand or upon viewport intersection.
8. Eliminating Presentation Delay and Layout Thrashing
Presentation delay occurs when the JavaScript callback finishes quickly, but the browser struggles to calculate the resulting layout and paint the frame. The primary culprit is Forced Synchronous Layouts (Layout Thrashing).
Layout thrashing happens when code alternates between reading geometric DOM properties (like offsetWidth, scrollTop, or getBoundingClientRect()) and writing DOM modifications (like element.style.width). Each read forces the browser to recalculate layout synchronously before proceeding:
// BAD: Layout Thrashing (Triggers multiple sync layouts)
elements.forEach(el => {
    const width = el.offsetWidth; // READ forces reflow
    el.style.width = (width * 1.2) + 'px'; // WRITE invalidates layout
});

// GOOD: Batched Reads and Writes
const widths = elements.map(el => el.offsetWidth); // BATCH READS
elements.forEach((el, i) => {
    el.style.width = (widths[i] * 1.2) + 'px'; // BATCH WRITES
});
9. Third-Party Script Governance and Tag Manager Isolation
In enterprise web ecosystems, marketing tag managers frequently inject dozens of analytics, behavioral heatmaps, and chat widgets. These scripts run on the main thread and install continuous event listeners on global window and document objects, driving input delay through the roof.
Audit and enforce strict third-party governance using the matrix outlined in Table 2:
| Script Category | Typical INP Impact | Optimization Protocol | Target Execution Mode |
|---|---|---|---|
| Analytics & Page Tracking | High (Event listeners on all clicks) | Proxy analytics events through Web Workers (e.g., Partytown) | Background Worker Thread |
| Heatmaps & Session Recorders | Severe (Continuous DOM mutation observers) | Sample only 5% of sessions; throttle mutation observer queues | Idle Callback / Delayed Load |
| Customer Support Chat Widgets | Severe (Loads heavy React/Vue runtime) | Facade pattern: show static SVG icon until user clicks to chat | On-Demand Dynamic Import |
| A/B Testing Frameworks | Moderate to High (Synchronous DOM rewrites) | Migrate from client-side DOM injection to edge-based SSR rewrites | Edge CDN Compute |
| Social Media Embeds & Pixels | Moderate (Resource contention & CPU bursts) | Lazy-load via IntersectionObserver when scrolled within 300px | Viewport Triggered Async |
For engineering teams automating data collection or testing edge architectures, explore our technical breakdown on building a custom multi-threaded web scraper with Python and Playwright to monitor your site's rendering performance at scale.
10. Real-World INP Remediation: The 5-Step Engineering Workflow
Follow this systematic procedure to resolve INP issues identified in Google Search Console:
- Step 1: Identify Offending URLs in CrUX: Navigate to Google Search Console > Core Web Vitals > Mobile. Identify URL groups flagged with "INP issue: longer than 200ms".
- Step 2: Replicate Field Conditions in DevTools: Open Chrome DevTools > Performance panel. Enable CPU throttling (4x or 6x slowdown) to simulate mid-tier mobile hardware, and record an interaction trace.
- Step 3: Analyze the Main Thread Flame Chart: Pinpoint tasks flagged with red diagonal hashes (Long Tasks > 50ms). Inspect the "Main" flame chart to identify whether time is spent in compile, evaluate script, or layout.
- Step 4: Refactor with scheduler.yield() or Web Workers: Break long loops, batch DOM operations, or delegate computations to worker threads.
- Step 5: Verify Field Validation: Deploy changes to production and trigger "Validate Fix" in Google Search Console to monitor the 28-day CrUX rolling window.
11. Frequently Asked Questions (FAQ)
What is a good Interaction to Next Paint (INP) score?
Google defines a good INP score as 200 milliseconds or less at the 75th percentile of page visits. Scores between 200ms and 500ms indicate that your page needs improvement, while scores exceeding 500ms are classified as poor and will trigger Core Web Vitals warnings in Google Search Console.
How does INP differ from First Input Delay (FID)?
FID only measured the input delay of the very first user interaction and ignored the time required to execute event handlers and render the visual frame. In contrast, INP measures the complete latency (input delay + processing time + presentation delay) across all clicks, taps, and keypresses throughout the entire user session.
Which user actions are measured by INP?
INP specifically measures discrete user interactions: mouse clicks, taps on touchscreen devices, and keypresses on physical or virtual keyboards. Scrolling and hovering are continuous gestures and are not evaluated by INP (scrolling is evaluated under Cumulative Layout Shift and visual smoothness).
Can CSS transitions and animations cause poor INP scores?
Yes. If animations trigger layout or paint properties (such as animating height, top, or margin) instead of GPU-accelerated properties (such as transform and opacity), the main thread becomes congested during the presentation phase, inflating INP significantly.
What is scheduler.yield() and how does it help INP?
scheduler.yield() is a modern web platform API that allows long-running JavaScript functions to cooperatively yield control back to the browser. The browser can immediately handle pending inputs and render visual updates before returning to continue the task, preventing long task bottlenecks.
Why does mobile INP tend to be significantly worse than desktop INP?
Mobile devices feature less powerful single-core CPU processors and tighter thermal constraints than desktop computers. Complex JavaScript parsing, garbage collection, and heavy DOM recalculations execute much slower on mobile chips, causing longer main thread freezes.
How does Google Search use INP in its ranking algorithms?
INP is an official Core Web Vitals metric incorporated into Google's Page Experience ranking signals. While high-quality, relevant content remains primary, meeting Core Web Vitals thresholds acts as an algorithmic tiebreaker and protects visibility across competitive commercial SERPs.
How can I measure INP in local lab environments before deploying to production?
You can measure INP locally using Chrome DevTools Performance panel (with CPU throttling enabled) or by installing the official Web Vitals Chrome Extension. Additionally, the Long Animation Frames (LoAF) API enables automated staging tests using tools like Lighthouse and Playwright.
Do third-party chat widgets and tag managers hurt INP?
Yes, third-party scripts are often the primary cause of high input delay. They attach extensive event listeners and execute continuous background timers. Implementing facade patterns (loading widgets only upon user intent) and isolating tracking scripts into Web Workers drastically improves INP.
How long does it take for INP improvements to show in Google Search Console?
Google Search Console reflects data from the Chrome User Experience Report (CrUX), which aggregates a 28-day rolling window of real-world user measurements. Once your optimization is deployed, you will see incremental improvements over 2 to 4 weeks until the full 28-day window reflects the new codebase.

Ratings & reviews
No reviews yet. Be the first.